This project has been developed by Bertha Brenes in LISIS laboratory with Nicola Ricci and Marc Barbier.
The objective of the project is to drive a digital enquiry of the agroecological turn in Costa Rica, more largely in Central America through the setup of consistent and appropriate datasets in order to analyze the production and circulation of knowledge through different channels of social media of webpages. Following this objective, we have created a mining program to extract all the possible data from the datasets defined with the researchers.
So in this period of mining and analysis data, after a little exploration of which is the most popular social media in Central America and where the greatest amount of information can be located. It was decided to explore:
- The repository of the Universities and research centers of Costa Rica
- Facebook, Youtube and Twitter
We have chosen the Costa Rican Universities because there can be located the biggest amount of the academic research of the Country. We also want to see the influence of the language in each dataset (How many language, how to separate and to tread the data) also to see the period of the time into the data. The way to explore each place was different and requires different techniques.
For the search we defined two queries, “agroecología OR agroecologico OR agricultura ecológica OR agro-ecología” and “agroecology OR agroecological OR agriculture ecological OR agro-ecology”. Those queries provide answers in french, italian, spanish, catalan, portugues and english. So all these data have to be delimited and filtered by country and not just for the language, because as we already saw in the Universities analysis, Spanish is not the only language used. There are some collaborations between students from different universities, so separate the data by language could confuse the original objective.
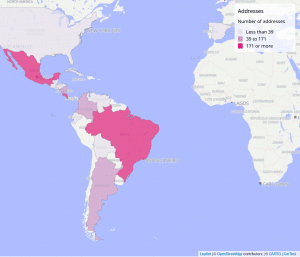
Cortext tool was very useful for all the language analysis, terms extraction in English and geo-localization on all the data.
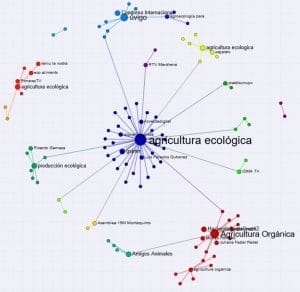
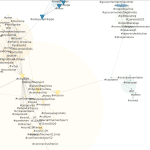
We placed all the information, analysis and results recollected during this 6 months in a web-page, open to everyone. You can interact with each map made with Cortext; each color represents a concentrate of data associated to a Term, Hashtag, etc and each line is the relation of the node. This let you understand how the information can be linked.
See more analysis for each analytical dimension here:


